 bar chart race
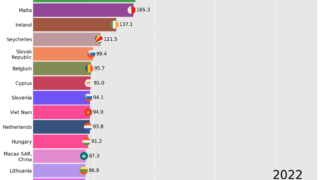
 Bar chart race of world exports of goods and services (% of GDP) from 1960 to 2022
Bar chart race of world exports of goods and services (% of GDP) from 1960 to 2022
bar chart race 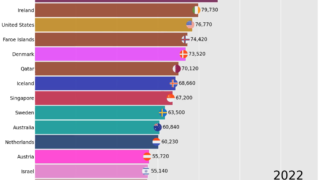 bar chart race
 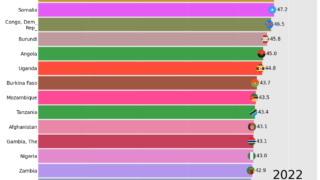 bar chart race
 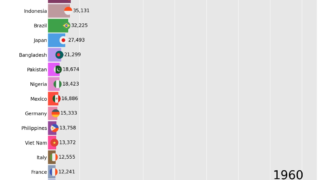 bar chart race
 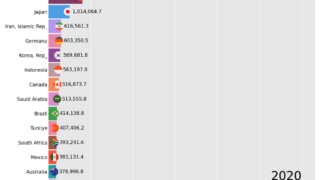 bar chart race
 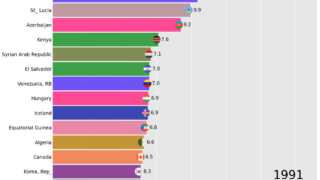 bar chart race
 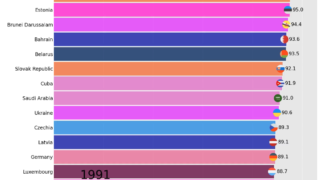 bar chart race
 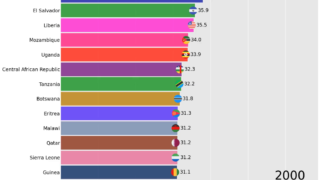 bar chart race
 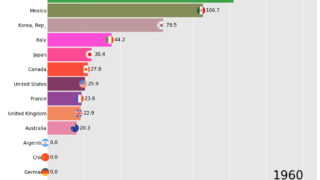 bar chart race
 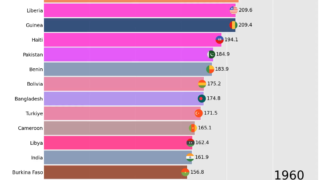 bar chart race