 bar chart race
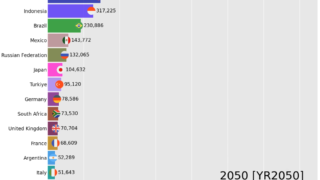
 Bar chart race of G20 population estimates and projections from 2020 to 2050
Bar chart race of G20 population estimates and projections from 2020 to 2050
bar chart race 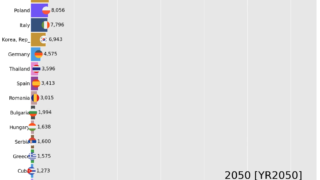 bar chart race