 bar chart race
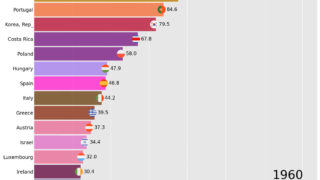
 Bar chart race of G20 member’s infant mortality rate (per 1,000 live births) from 1960 to 2021
Bar chart race of G20 member's infant mortality rate (per 1,000 live births) from 1960 to 2021
bar chart race 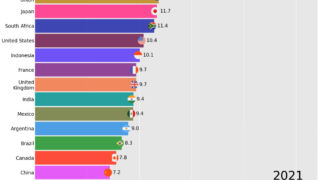 bar chart race
 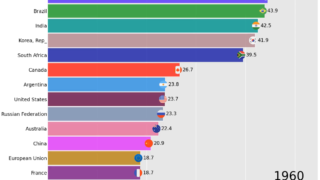 bar chart race
 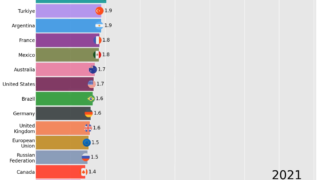 bar chart race
 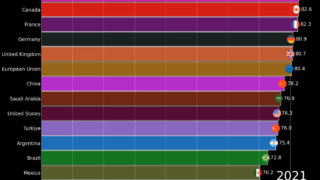 bar chart race
 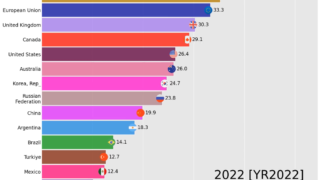 bar chart race
 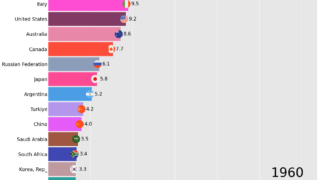 bar chart race
 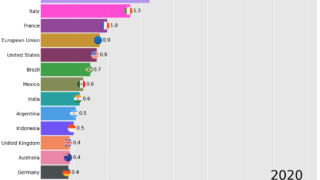 bar chart race
 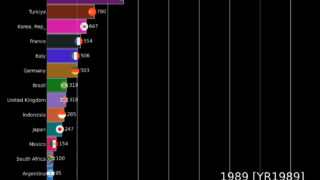 bar chart race
 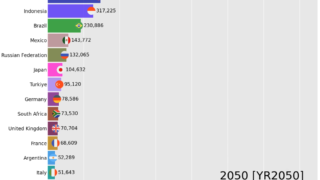 bar chart race