 bar chart race
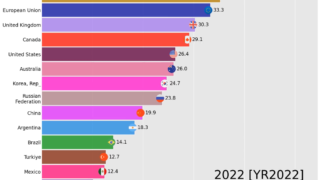
 Bar chart race of G20 member’s age dependency ratio, old (% of working-age population) from 1960 to 2022
Bar chart race of G20 member's age dependency ratio, old (% of working-age population) from 1960 to 2022
bar chart race 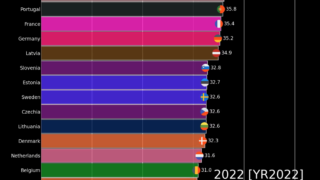 bar chart race
 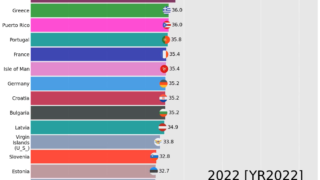 bar chart race
 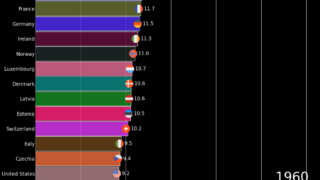 bar chart race
 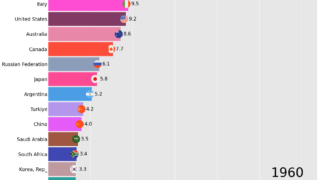 bar chart race
 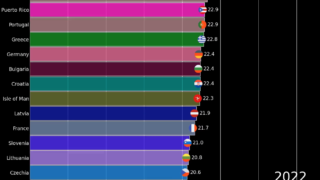 bar chart race
 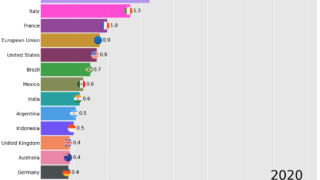 bar chart race
 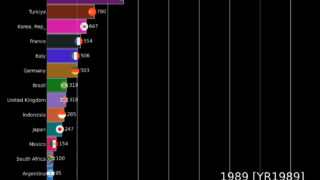 bar chart race
 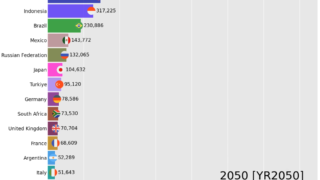 bar chart race
  bar chart race