 bar chart race
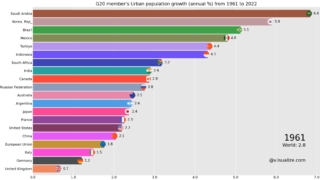
 Bar chart race of G20 member’s Urban population growth (annual %) from 1961 to 2022
Bar chart race of G20 member's Urban population growth (annual %) from 1961 to 2022
bar chart race  bar chart race
  bar chart race
  bar chart race
 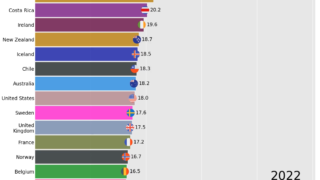 bar chart race
 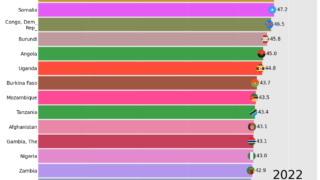 bar chart race
 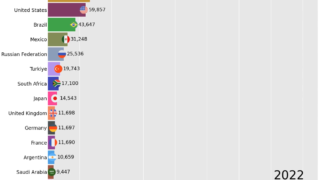 bar chart race
 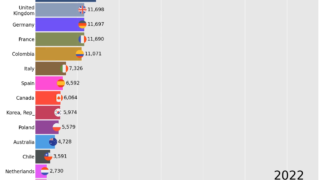 bar chart race
 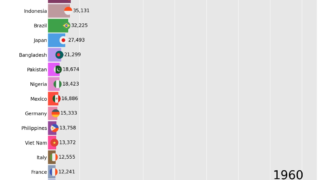 bar chart race
 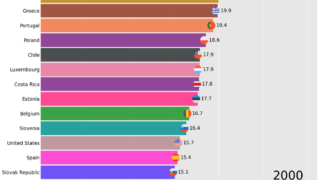 bar chart race