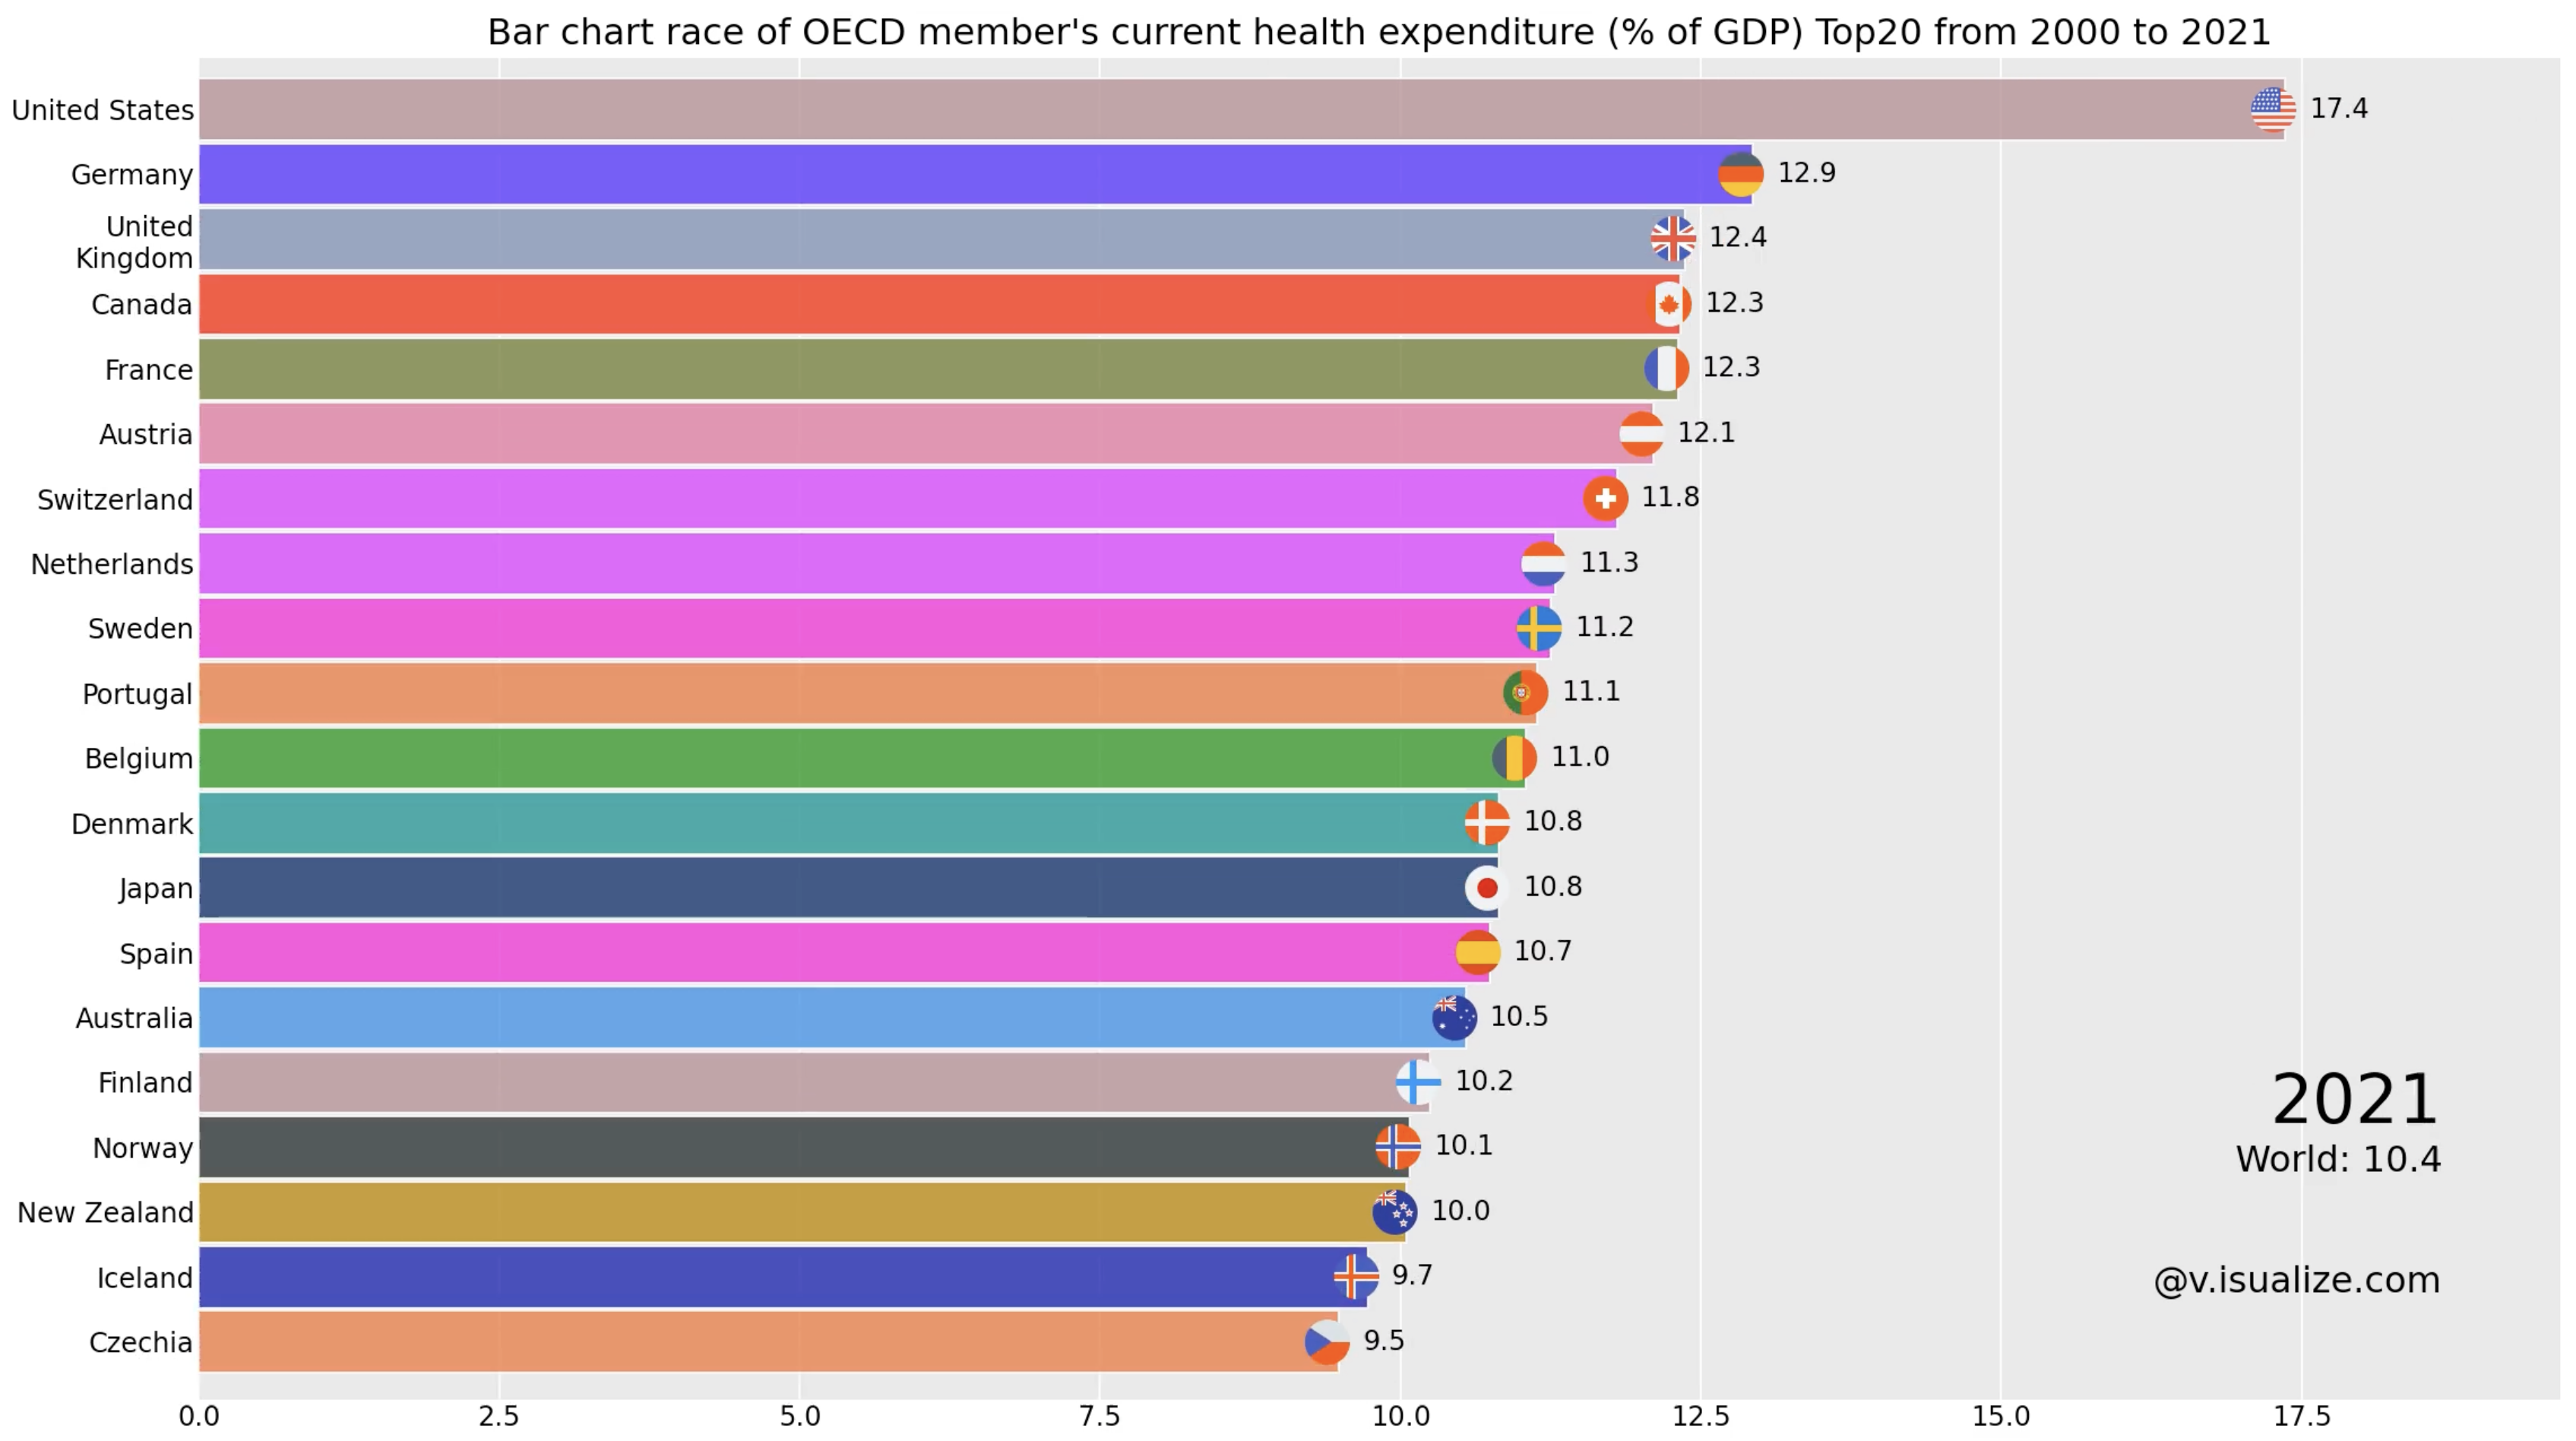
Level of current health expenditure expressed as a percentage of GDP. Estimates of current health expenditures include healthcare goods and services consumed during each year. This indicator does not include capital health expenditures such as buildings, machinery, IT and stocks of vaccines for emergency or outbreaks.
Reasons behind trends:
- High healthcare expenditure in OECD countries like the US, Switzerland, and Germany is driven by advanced medical technologies, high service costs, and comprehensive systems, resulting in significant spending on administration and high-quality care.
- Aging populations and universal healthcare coverage contribute to increasing spending in countries such as Japan, France, and Canada, with significant investments needed to support high life expectancy and comprehensive healthcare services.
- Strong public healthcare systems and significant government investments lead to consistently high expenditure in countries like Sweden, Norway, and the Netherlands, focusing on high living standards, extensive coverage, and quality healthcare infrastructure.
Source: THE WORLD BANK, OECD
Comments