Debt is the entire stock of direct government fixed-term contractual obligations to others outstanding on a particular date. It includes domestic and foreign liabilities such as currency and money deposits, securities other than shares, and loans. It is the gross amount of government liabilities reduced by the amount of equity and financial derivatives held by the government. Because debt is a stock rather than a flow, it is measured as of a given date, usually the last day of the fiscal year.
Reasons behind trends:
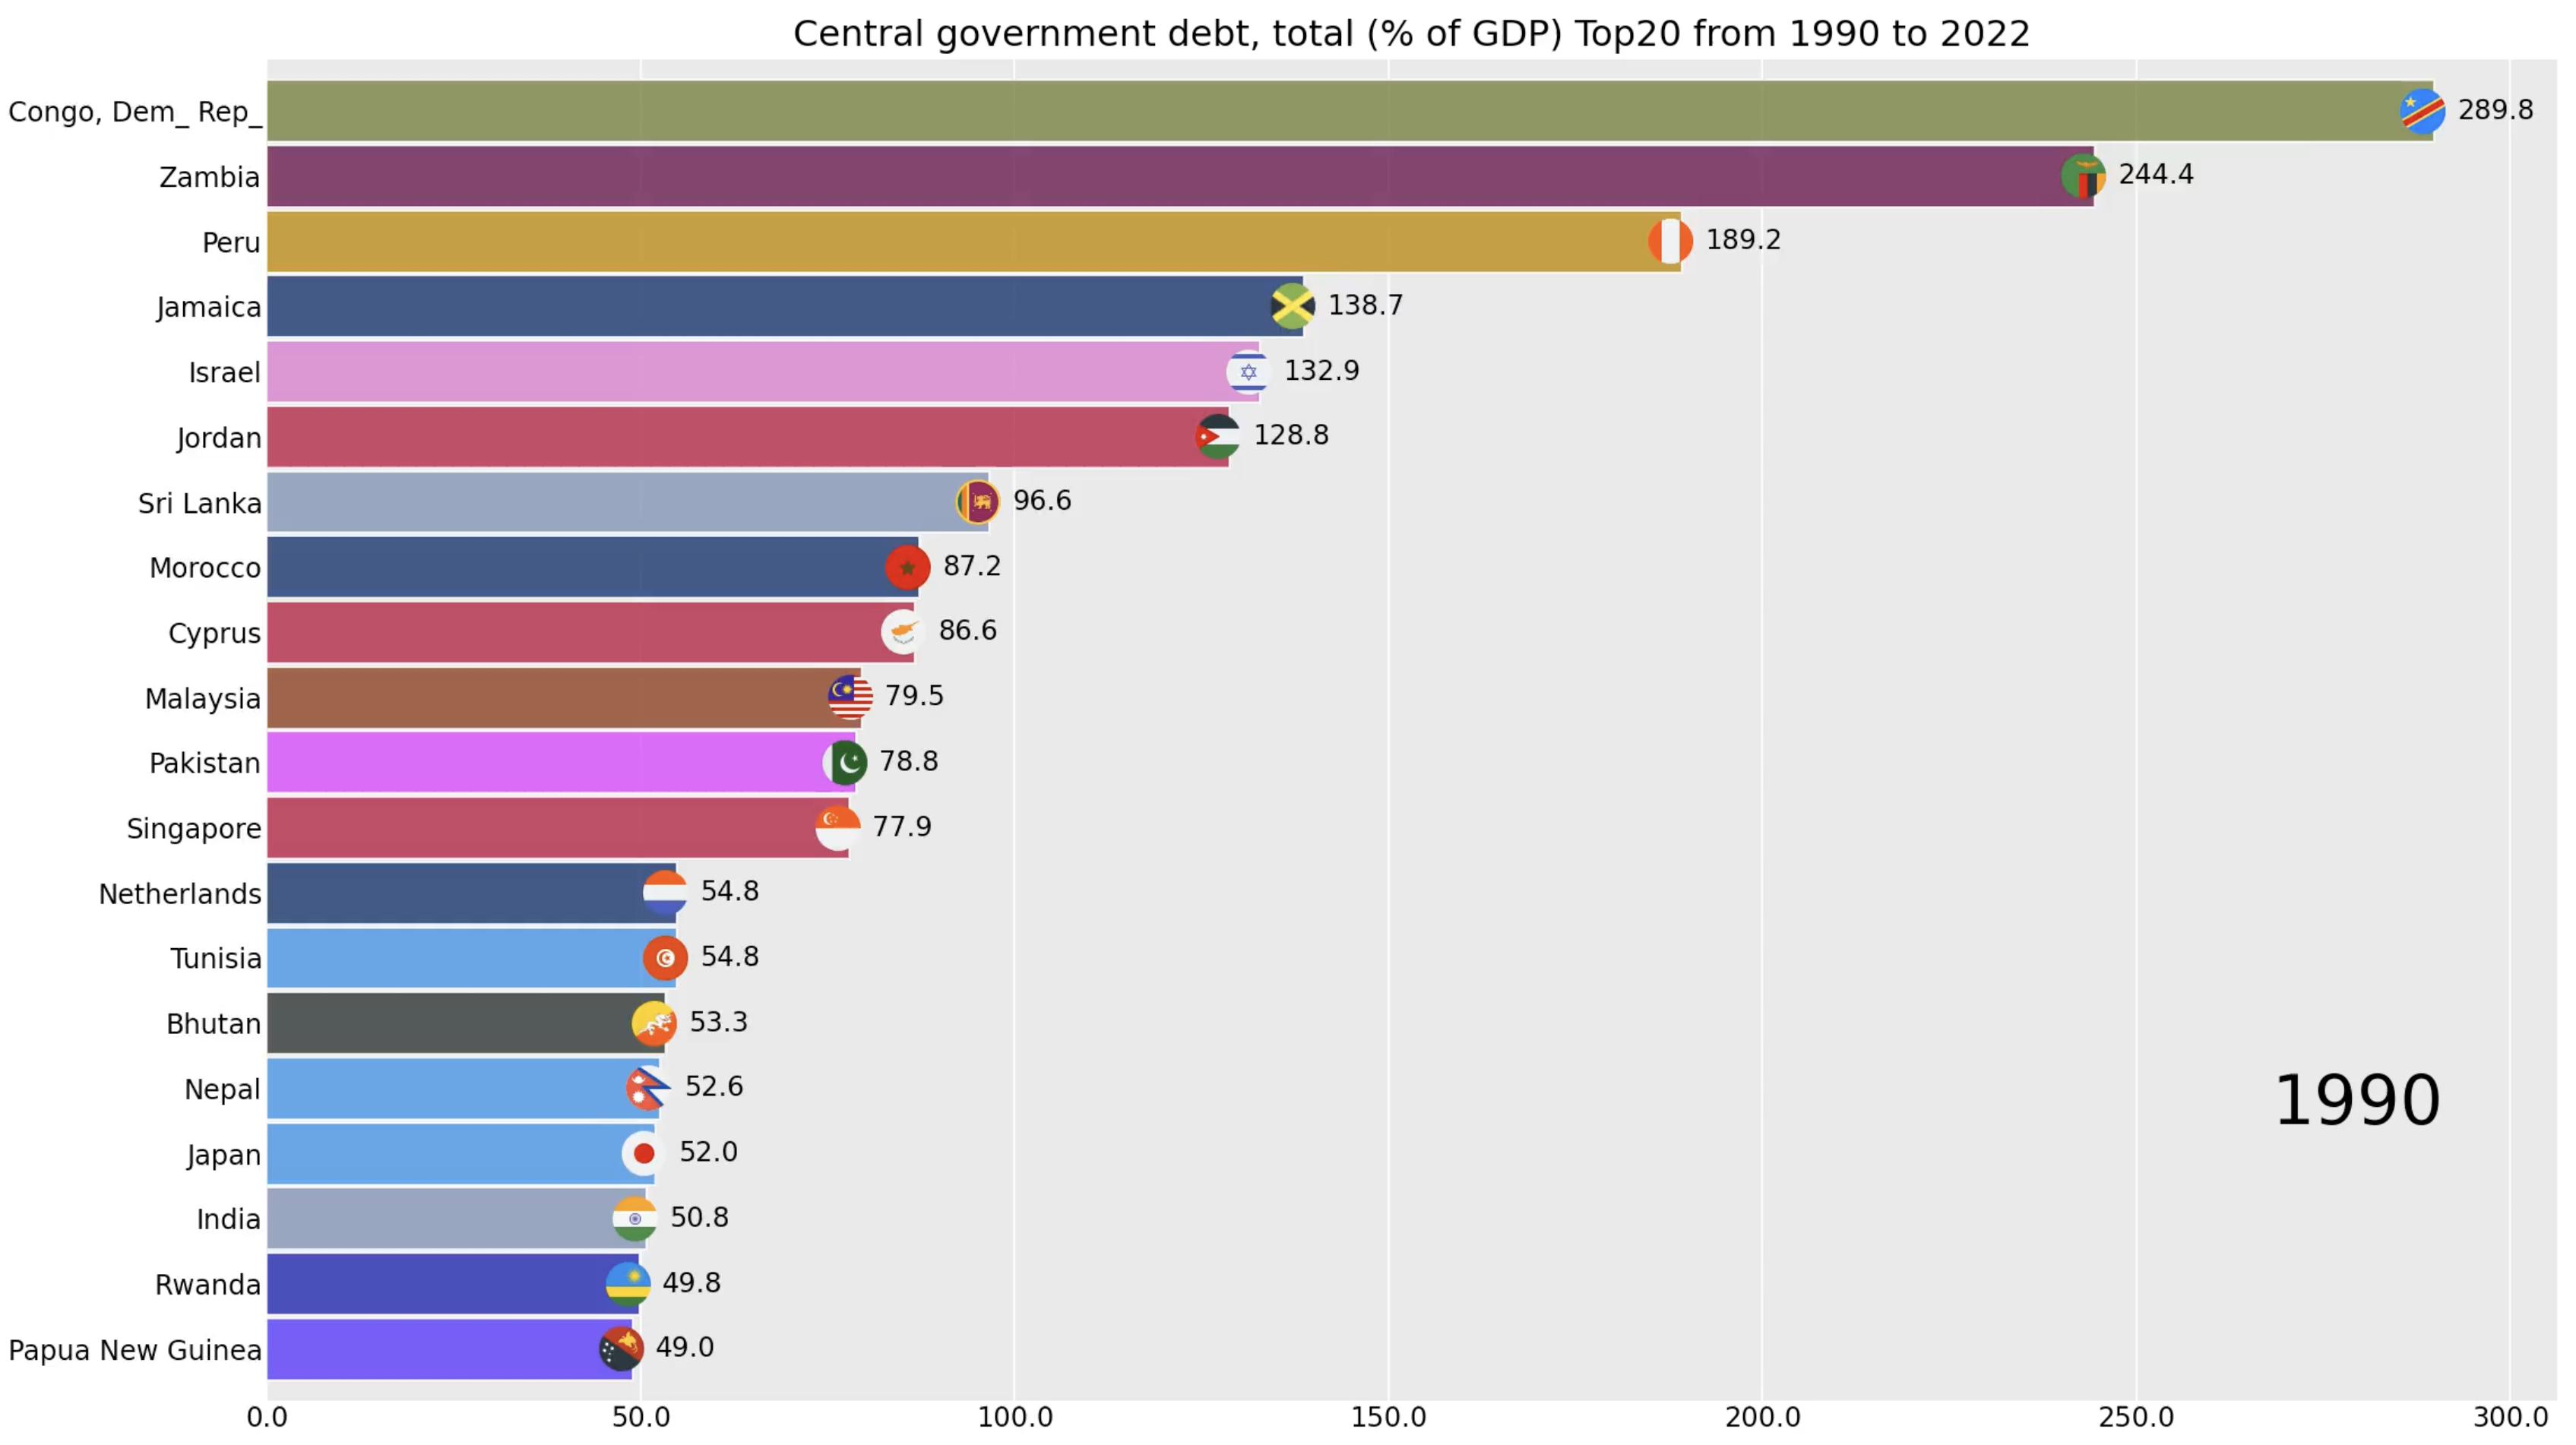
- High Debt Levels: Countries like Greece, Japan, and the Democratic Republic of Congo consistently show high levels of central government debt relative to their GDP. Greece and Japan, in particular, have had periods where their debt exceeded 200% of GDP, indicating severe fiscal imbalances.
- Economic Crises: Many countries experienced significant increases in debt around periods of economic crises. For example, Greece’s debt surged during the Eurozone crisis (around 2009-2015), reflecting the country’s financial struggles and bailout conditions. This period marked a dramatic rise in borrowing to stabilize the economy.
- Developing Countries: Developing nations, such as the Democratic Republic of Congo and Zambia, also show high debt levels, often due to political instability, reliance on external borrowing, and economic challenges. These countries face difficulties in managing debt due to limited fiscal resources and external shocks.
- Fluctuations: Several countries exhibit fluctuations in their debt levels due to various economic policies, changes in government, and global economic conditions. For instance, Japan’s debt has steadily increased over the years due to prolonged economic stagnation and deflation, coupled with large fiscal stimulus packages aimed at revitalizing the economy.
Source: THE WORLD BANK

Comments