Our mission is to visualize any data and see what happens in the world.
blog.v.isualize.com

2024-08

bar chart race

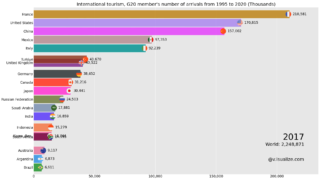
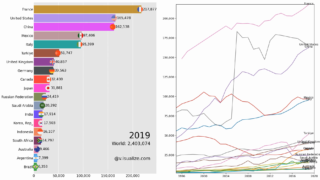
Bar and line chart race of G20 member’s International tourism, number of arrivals from 1995 to 2020 (Thousands)

Bar and line chart race of G20 member's International tourism, number of arrivals from 1995 to 2020 (Thousands)
2024.08.20
bar chart raceG20line chart racetrade
bar chart race

Bar chart race of G20 member’s International tourism, number of arrivals from 1995 to 2020

Bar chart race of G20 member's International tourism, number of arrivals from 1995 to 2020
2024.08.06
bar chart raceG20trade

最近の投稿

  • Line chart race of 2024 Presidential National Polls (Updated Oct. 28, 2024)
  • Line chart race of 2024 Presidential National Polls (Updated Oct. 14, 2024)
  • Line chart race of 2024 Presidential National Polls (Updated Sep. 21, 2024)
  • Line chart race of 2024 Presidential Polls (Updated Sep. 14, 2024)
  • Line chart race of 2024 Presidential Polls

最近のコメント

No comments to show.

アーカイブ

  • October 2024
  • September 2024
  • August 2024
  • July 2024
  • June 2024
  • May 2024
  • April 2024
  • March 2024
  • February 2024
  • January 2024
  • December 2023
  • November 2023
  • October 2023

カテゴリー

  • agriculture
  • bar chart race
  • climate change
  • economy
  • finance
  • G20
  • GDP
  • gender
  • GNI
  • health
  • labor
  • line chart
  • line chart race
  • military
  • OECD
  • population
  • poverty
  • presidential polls
  • trade
  • urban development
  • USA
  • world
blog.v.isualize.com
© 2023 blog.v.isualize.com.
  • Home
  • Top