 bar chart race
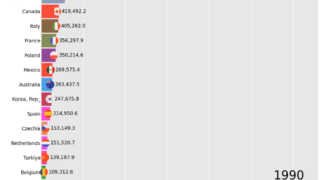
 Bar chart race of OECD member’s CO2 emissions (kt) Top20 from 1990 to 2020
Bar chart race of OECD member's CO2 emissions (kt) Top20 from 1990 to 2020
bar chart race 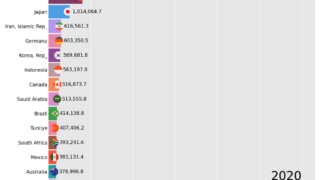 bar chart race