 bar chart race
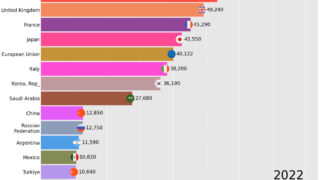
 Bar chart race of G20 member’s GNI per capita, Atlas method (current US$) from 1962 to 2022
Bar chart race of G20 member's GNI per capita, Atlas method (current US$) from 1962 to 2022
bar chart race 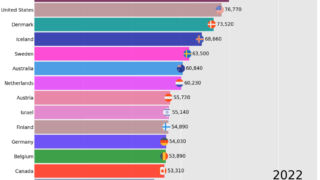 bar chart race
 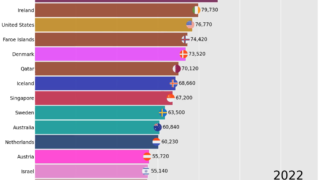 bar chart race
 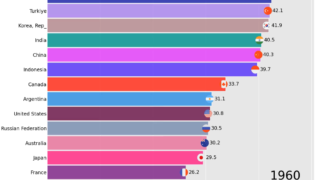 bar chart race
 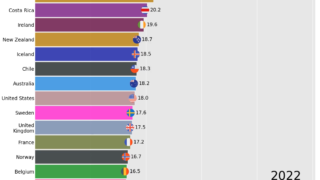 bar chart race
 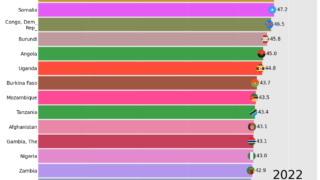 bar chart race
 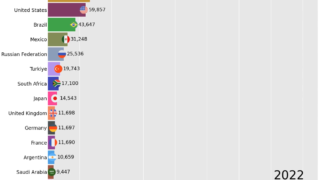 bar chart race
 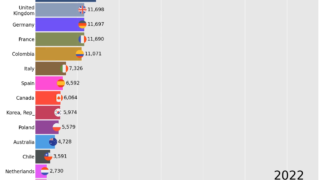 bar chart race
 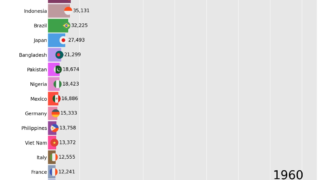 bar chart race
 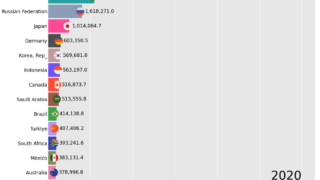 bar chart race