 bar chart race
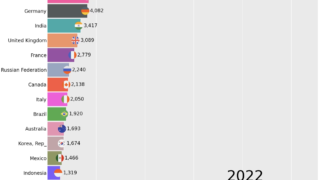
 Bar chart race of G20 members GDP from 1960 to 2022
Bar chart race of G20 members GDP Top20 from 1960 to 2022
bar chart race 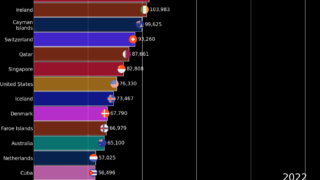 bar chart race
 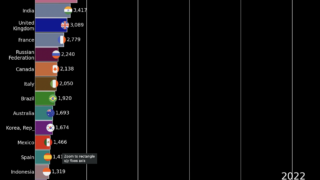 bar chart race
 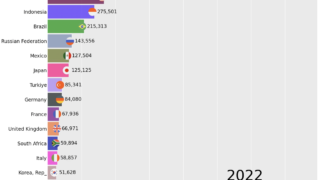 bar chart race